The Bug Rating Matrix: A Simple System for P0–P3 Prioritization
If you’ve ever sat in a bug triage meeting debating whether something is critical or just annoying, you already know the problem: without a shared rubric, priority labels become subjective. One engineer says “blocker,” a tester says “cosmetic,” and suddenly release confidence drops into a black hole.
That’s where the Bug Rating Matrix comes in. It replaces gut feel with a simple, repeatable model: Business Impact × Likelihood of Use.
The Core Idea
The matrix has two axes:
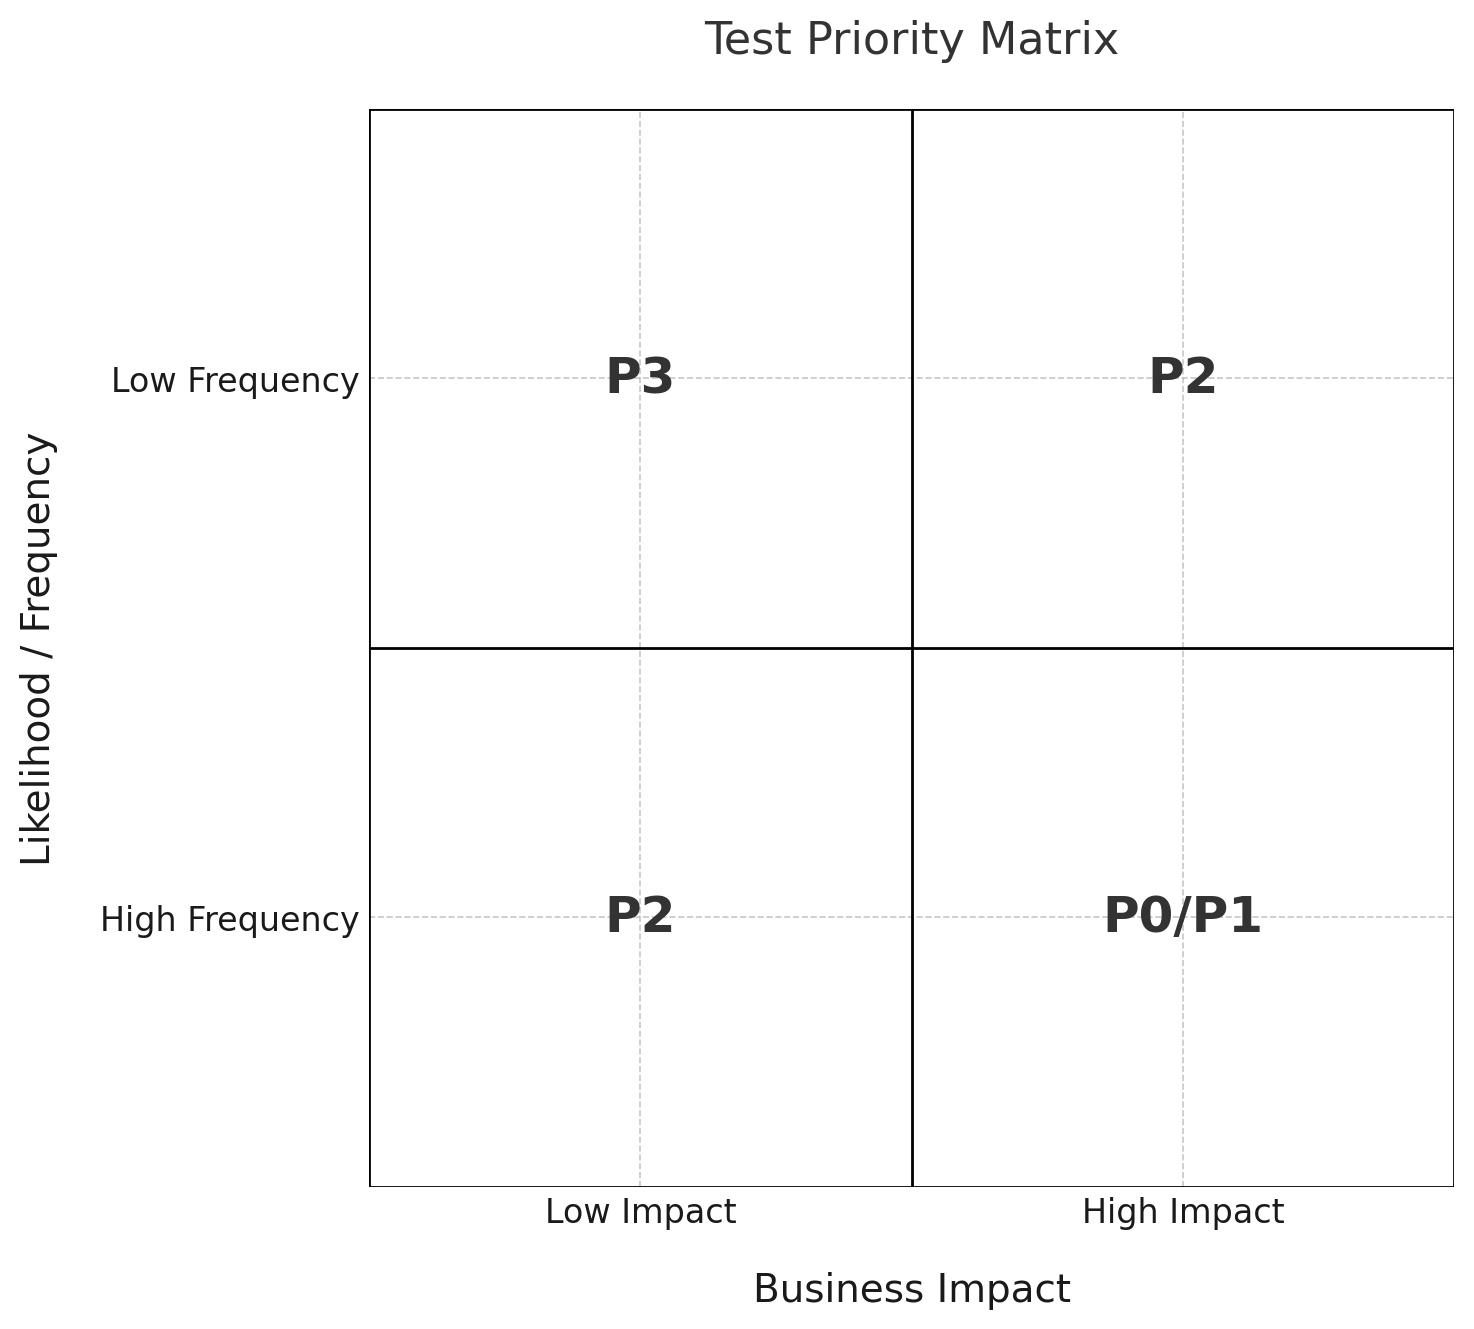
- Business Impact (X-axis): How much does this affect users, revenue, or compliance?
- Likelihood / Frequency (Y-axis): How often will users hit this path in real-world use?
Put them together, and you get four quadrants:
- P0/P1 (Top-Right: High Impact × High Frequency)
Showstoppers. Login down, payments failing, app crash on startup. No release goes out with these open. - P1/P2 (High Impact × Low Frequency OR Medium Impact × High Frequency)
Important workflows. Think: booking appointments, viewing medical records, search results not loading. Must-fix before GA. - P2 (Low Impact × High Frequency OR Medium Impact × Medium Frequency)
Usability annoyances or degraded secondary features. Ship with them if needed, fix in future sprint. - P3 (Low Impact × Low Frequency)
Edge cases and polish. Typos, cosmetic spacing, obscure crashes in Safari 12. Great backlog fodder.
Why This Works
- Removes Subjectivity
Instead of “I feel this is important,” you anchor every decision to impact and likelihood. - Enables Consistent Triage
Developers, testers, and PMs can all look at the same bug and land in the same quadrant. - Prioritizes Business Risk, Not Just Tech Risk
A bug in the “Year Dropdown” might be technically easy to fix, but it only impacts a small fraction of users. That’s P2, not P0. - Scales with Team Size
Whether you’re 2 people or 200, the matrix gives everyone the same decision framework.
Real-World Examples
Let’s map some common scenarios:
- Login fails with 500 error → High Impact, High Frequency → P0
- Search field doesn’t return results → High Impact, High Frequency → P1
- CSV export broken → Medium Impact, Low Frequency → P2
- Page header misaligned → Low Impact, High Frequency → P3
- Year dropdown missing → Low Impact, Low Frequency → P2
Notice the nuance: it’s not just about what is broken, but how often users encounter it.
How to Apply This
- In Test Planning
Before automating or writing manual test cases, assign each one a priority label (P0–P3) using the matrix. This ensures your CI/CD runs focus on the highest-risk flows first. - In Bug Triage
Drop each bug into the matrix instead of debating its importance. A cosmetic bug with low traffic? That’s P3—don’t hold the release for it. - In Release Readiness
Use the rule of thumb:- No open P0s.
- P1s must be addressed before GA.
- P2s are negotiable.
- P3s belong in backlog polish.
- For Team Training
Give your testers and developers a one-pager cheat sheet with common examples (Login, Search, Export, Headers). Over time, you’ll see consistency emerge naturally.
Where It Helps Most
- Healthcare & Regulated Industries
Where compliance and safety demand a crisp definition of “blocking.” - Startups Scaling CI
Keeps your automation focused on golden paths, not cosmetic noise. - Distributed Teams
When everyone’s in different time zones, a shared decision framework cuts down on Slack debates.
Simple = Powerful
The Bug Rating Matrix is powerful because it’s simple. High Impact + High Frequency = Stop Everything. Low Impact + Low Frequency = Fix Later. Everything else lives in between.
The result? Fewer debates, faster triage, and a team that spends its energy on the right bugs; not just the loud ones.


Comments ()